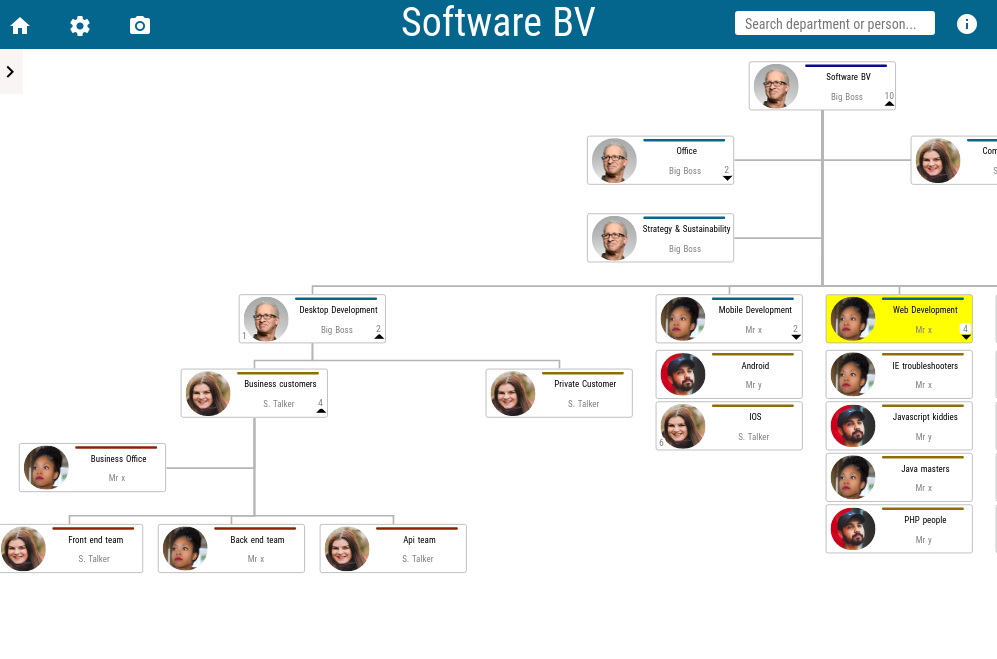
Create your own interactive organizational chart. 100% free. Very easy install and runs in your browser


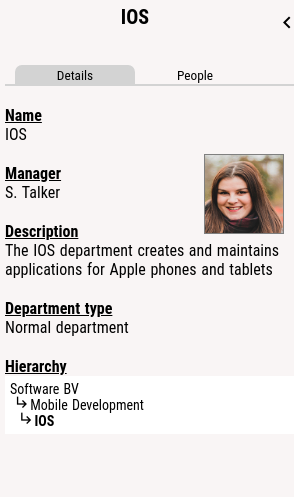
Show department details
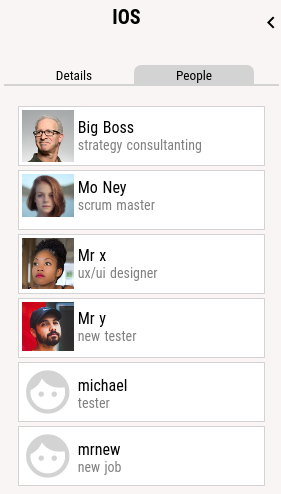
Show and edit the details of the department and employee profiles


Completely Safe and Free
Run locally
Just unpack the zip-file to a group folder or your webserver. All your data remains local
Edit via web or excel
Editing can be done via the webbrowser using an easy interface, or you can upload an excel sheet (for bulk updates)

A unique solution
There are many organizational chart solutions, so why this one?
- Unlimited free and open source
- Easy to customize and install
- Very fast response times
Features
Frequently asked questions
Where is my data kept?
The data is only kept where you put it yourself (see: How do I save the changes for others to see?). It is not send to any other location, so it is completely safe to use.How can I change/edit the graph?
Type '_edit' in the searchbar (without quotes) to swith to editmode. Now you can edit the graph in the application or update via excelHow does editing work in the application?
- Left-click on a department and edit the name, description of type staff in the left screen.
- To change the manager, press the pencil and search for the right person or add a new person
- Add people the same way (use the people tab in the left screen). You can also provide the role the person has in the department
- Right-click on a department in the chart to add a department below
- With right-click you can also move a department: select Cut, then click on another department and right-click and select paste. Do not paste a parent under one of its children (this check has to be build)
How does editing work in excel?
Select File > Export excel. It contains:- chart: id, name, description, parent, indicator for staff department, and id of the manager (from the people tab)
- people: id, name, link to photo (see also config.js above), and main role/function of the person. There are also extra fields which you can specify in the config
- assignment: department id (from chart tab), person id (from people tabl) and role. These are the people working for the department. (manager is assigned in the chart tab) People can be assigned to multiple departments, or even more times to 1 department (with different role for example)
How do I save the changes for others to see?
Everything happens at client side, so changes are only available for you. And if you refresh the page the changes will be gone. To make the changes persistent you must select File > Generate inputfile to create a javascript file which contains the data. This file (data.js) you then must place in the root folder this application is at, replacing the already existing file data.jsWho can edit the graph?
Anyone can edit, but as stated above, it will be only available for that person. To make the data available for others, you need write access to the folder this application is at, so you can overwrite the data.js fileHow do I change the order of the departments under a parent?
This is not directly supported. There are 2 possibilities however. First switch to editmode. 1) export to excel, then change the order in the sheet, and then read the excel in again 2) cut the department, and paste it under the same parent again. It will be placed last.How can I customize the application?
In editmode select File > Configure options. Change the settings and press "Generate config". Save the generated file, replacing the config.js in the root folder. You can restore the original config by copying the config_default.js over the config.js in the root folderThe names in the department boxes do not fit....
See step above. Change under 'Department boxes' the 'Box width' and 'Box height'How can I customize the fields of a person?
You can do that in File > Configure options, see previous question. These fields are then also added if you export in excel, they start with "field_"How can I use a different languate?
There are a few fields you can change the name of. You can change them in the file "translate.js"How can I use this in my own code?
This is not meant to be a plugin/library, but it is a complete solution. If you want to use this as a part of your own application I recommend to search for a real orgchart plugin.
Easy as 1-2-3
Try it out now
- 1a) Download orgchart.zip and extract the zip on your PC.
- 1b) -Or- copy content of \docs folder directly from this repository
- 2) Copy \docs to any location, like a folder on your computer, AWS S3 bucket or webserver
- 3) Open index.html in the browser. For usage instructions see FAQ
